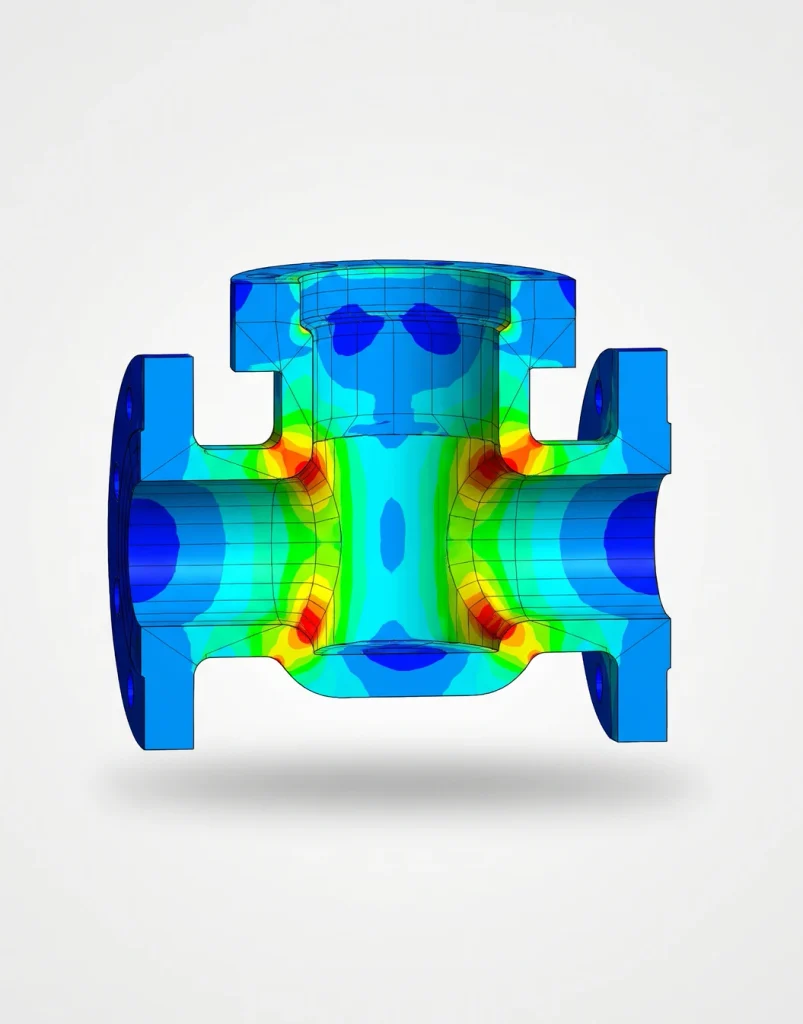
Ask five reservoir engineers to size a surface choke for the same well and you may get five different answers — not because anyone did the math wrong, but because there is no single, universally accepted formula for two-phase flow through a choke. Our Choke Bean Sizing calculator is built around that reality: it lets you choose between the five most widely cited correlations rather than pretending one of them is “the” answer.
Why there’s no single “correct” choke formula
A surface choke throttles a mixture of oil, gas, and sometimes water — a genuinely hard fluid-mechanics problem with no clean closed-form solution. Since the 1950s, engineers have instead fit empirical correlations directly to measured field data: Gilbert (1954) from California’s Ten Section Field, Baxendell (1957) and Ros (1960) from Shell’s Lake Maracaibo wells, Achong (1961) also from Maracaibo, and Pilehvari (1980) from University of Tulsa flow-loop testing. Each is a curve fit to a specific dataset, not a derivation from first principles — which is exactly why they don’t agree with each other. On the same well, two correlations can predict choke sizes or pressures that differ by 30% or more.
A comparison against 155 independent well tests found Gilbert’s original correlation gave the best overall match to measured production rates, which is why it’s the default here — but “best on average across 155 wells” is not the same as “correct for your well.” If you have field-calibrated choke performance data for your own asset, that should always take priority over any generic correlation.
The common formula shape
Despite their different origins, all five correlations share the same functional form for critical (sonic) flow:
P1 = C × GLR^m × q / S^nwhere P1 is the upstream (wellhead) flowing pressure in psia, q is gross liquid rate in STB/d, GLR is the producing gas-liquid ratio in scf/STB, and S is the choke size in 64ths of an inch — the standard way choke beans are specified in the field. C, m, and n are the fitted constants that differ by correlation:
- Gilbert (1954): C=10, m=0.546, n=1.89
- Ros (1960): C=17.4, m=0.5, n=2.0
- Baxendell (1957): C=9.56, m=0.546, n=1.93
- Achong (1961): C=3.82, m=0.65, n=1.88
- Pilehvari (1980): C=46.67, m=0.313, n=2.11
Solving for the choke size needed to hold a target upstream pressure just inverts the equation:
S = (C × GLR^m × q / P1)^(1/n)Why “critical flow” matters — and why downstream pressure doesn’t appear
Notice the formula has no downstream pressure term at all. That’s not an omission — it’s the defining feature of critical (sonic) flow: once the mixture velocity through the choke reaches the local speed of sound, pressure changes downstream (in the flowline or separator) simply can’t propagate back upstream through the restriction. The choke “chokes,” and upstream pressure becomes independent of whatever is happening after it.
That independence only holds while the downstream-to-upstream pressure ratio (P2/P1) stays below a critical threshold, commonly cited around 0.5–0.7 for oil-gas mixtures. Cross the threshold and flow becomes subcritical — downstream pressure starts to matter, and none of the Gilbert-type correlations apply; a different model (Ashford’s or Sachdeva’s subcritical formulations) is needed instead. The calculator checks this ratio for you and flags it if the critical-flow assumption looks doubtful.
Worked example
A well is expected to produce 500 STB/d at a GLR of 800 scf/STB, and the target upstream (wellhead) pressure is 1,200 psia, with an anticipated flowline pressure of 300 psia downstream (P2/P1 = 0.25, comfortably critical). Using Gilbert’s correlation:
- S = (10 × 800^0.546 × 500 / 1,200)^(1/1.89) = 14.68/64 in
Since chokes only come in discrete standard sizes, the nearest stocked bean is 14/64 in — which, run back through the same formula, actually produces about 1,312 psia rather than the exact 1,200 psia target. Stepping up to the next standard size, 16/64 in, drops it to about 1,019 psia. That roughly 300 psi swing between adjacent standard choke sizes is a normal, expected part of choke selection — not a calculation error — which is why the calculator shows both neighboring sizes and their actual resulting pressures rather than just the theoretical exact value.
What this doesn’t cover
These correlations were fitted mainly over a GLR range of roughly 300–50,000 scf/STB and choke sizes of 8/64–64/64 in; results outside that range are extrapolation. None of them account for erosion velocity limits, sand production, hydrate formation across the pressure drop, or slugging — all of which can independently constrain choke selection regardless of what the rate correlation says. And because these are field-fitted, not physics-derived, the single most useful check available is always your own well’s historical choke performance data, if you have it.
Try the Choke Bean Sizing calculator yourself — switch between correlations to see how much the “right” answer can move depending on which fit you trust.